The key features of the software
Serial Port Monitor is chock-full of advanced features and here are just some of them:
Serial data logging
Whether you want to check if a specific serial device is sending or receiving data as it should, or you need to see which data is going through the exact COM port, Serial Port Monitor will easily capture, log, and present the data in an extremely easy-to-read way. More than that, the advanced filtering and search options supported by the program will greatly simplify your work.
Analyzing COM port data
Anytime you need to read data going via a particular serial port, you can connect to it with advanced Serial Port Monitor even if the port has already been opened by another program. The software will capture data in real time and show it in one of its viewing modes (or all of them at a time, if necessary), so you can immediately compare and analyze it.
What's also nice is that the software allows copying the captured data to the clipboard or redirecting it to a file. This way, for instance, you can read and save serial input/output control codes (IOCTLs) with full details and parameters.
Sniffing multiple ports at a time
Another thing that you can find extremely useful about the program is its ability to sniff several COM ports simultaneously. With this unique option, you can check how your serial app communicates with multiple interfaces or devices at a time within one monitoring session. Plus, the received and sent data will be recorded into a single log using the first-in first-out method, which is especially convenient for data analysis.
Presenting data in different viewers
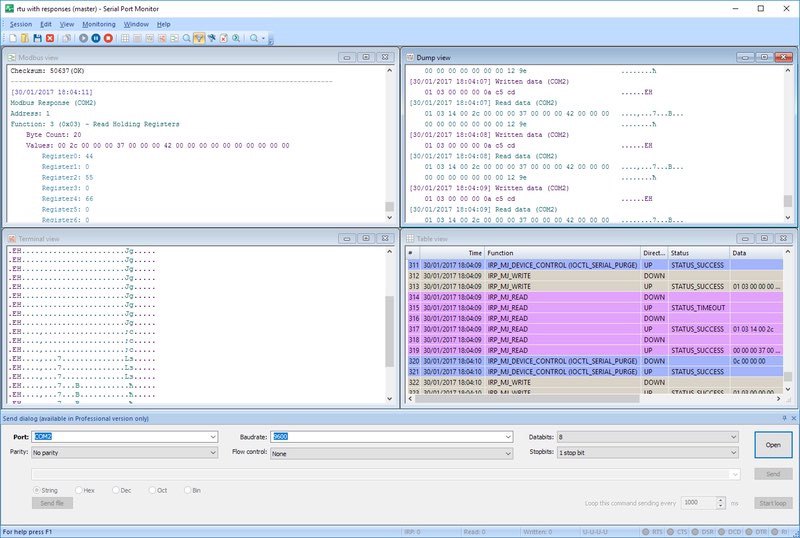
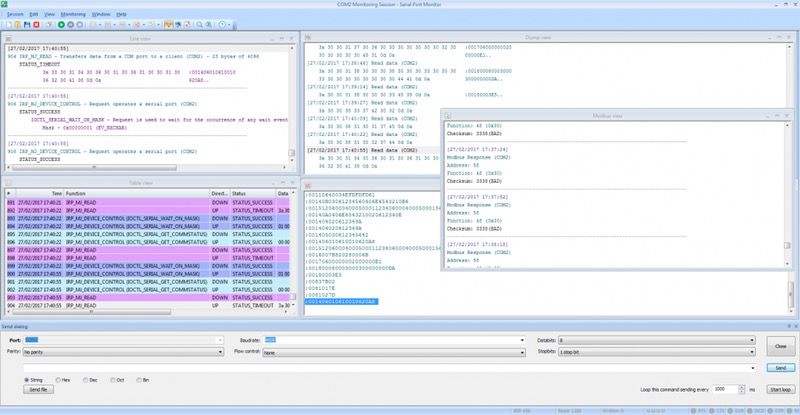
Without a doubt, the availability of four different data visualizers is one of the program’s advantages over other similar solutions. Serial Port Monitor Windows 10 solution can display data in table, line, dump, terminal mode, or all of them simultaneously. You can choose between the modes depending on your goals. Each visualizer has its benefits. For example, the Dump view displays data in hexadecimal and string formats, whereas the Table view presents the table consisting of the recorded IRPs, etc.
Emulation of sending data
Using the terminal mode feature, you can emulate sending serial data to the sniffed port. The port will recognize data as though it were sent by a particular application. This way you’ll get the ability to track the reaction of required devices to special commands and data. Serial Port Monitor supports string, binary, octal, decimal, hexadecimal, and mixed data formats.
Support for Modbus protocol
Serial Port Monitor works with Modbus RTU and Modbus ASCII protocols. In addition to Modbus data, this program will let you read and record communications with RS485/RS422/RS232 devices and apps.
Learn more about the basic principles of Modbus communication and the most efficient Modbus monitoring software and hardware solutions for testing and debugging Modbus-based devices and networks with Modbus tester guide.
Session playback feature
With Serial Port Monitor Windows 7, 10, you can resend data received from a particular serial application to the port one more time. This method will let you check if your monitoring results are precise as you’ll be able to review COM port’s behavior on receipt of the same serial data. Above that, the differences between the monitoring sessions can be displayed automatically, thanks to the outstanding capabilities of the software.
How to monitor serial port
Serial Port Monitor is a user-friendly software that aside from a host of advanced features offers a clean and intuitive interface.
Here’s how to create serial port monitor connection and use this program for sniffing serial interfaces:
- Download Serial Port Monitor and install it on your computer.
- Launch the app and start a monitoring session.
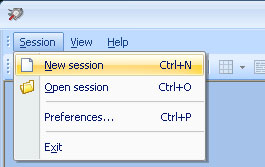
To do this, head to the Main menu > Session > New session. Alternatively, you can click the ‘New’ on the main toolbar or use the ‘Ctrl + N’ keyboard shortcut.

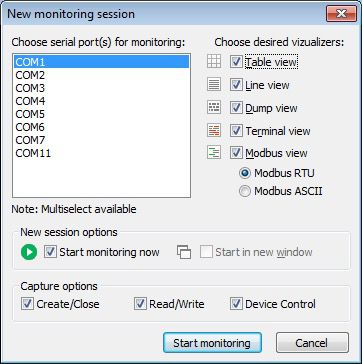
- Now, in the “New monitoring session” window, choose the view modes which will be used to display the captured data.

Select the desired modes or use the 'Select all ’ or 'Select none’ buttons to simplify your selection.
- Then, decide on whether to start the monitoring session immediately or start it in a new window.
- You can also specify what events you are interested in with the ‘Capture options’ – Create/Close, Read/Write, Device Control.
- Finally, click the ‘Start monitoring’ button to start your session.

In order to save a monitoring session, choose ‘Session > Save session/ Save session As’ in the Main menu. Or click ‘Save’ on the main toolbar or use the ‘Ctrl + S’ keyboard shortcut.

